London Capital Stack 2026: How a 17-Point Bifurcation Repriced Every Layer
I look at every layer of the London capital stack differently in 2026 to how I looked at it in 2025, and the reason is a single number: 17 percentage points. That is the spread between Kensington and Chelsea at -11.2% year on year and Walthamstow at +5.9% over the same window. Greater London’s headline -3.3% number is the average of those two stories, and it is the average of nothing useful for an active developer.
This piece is about what the spread does to the stack. Senior debt prices differently on each side. Stretched senior is available on one side and effectively absent on the other. Mezzanine pricing widens by 100 basis points or more. Forward funding from BTR and PBSA institutions has restarted on the connected outer side and stalled on the inner-prime side. Underwriting a London scheme without first locating it on the spread is now a category error.
What is actually moving where
The inner-prime correction is concentrated in the highest-value postcodes. Westminster is down 10.8% over the same window. Mayfair values have softened materially as international buyer activity remains structurally lower than the 2014–2019 baseline. The high-value end of Hammersmith and Fulham has tracked similarly.
The connected outer growth zone is concentrated where transport infrastructure has reshaped accessibility. Walthamstow leads at +5.9%. Redbridge is up 5.3%. Bromley is up 3.0%. Croydon is up 2.5%. The Elizabeth Line, Overground extensions and PTAL upgrades collectively explain most of the outperformance.
In between sits a wide middle band — most of Greater London’s boroughs are essentially flat to slightly down, neither part of the prime correction nor benefiting from the outer-borough transport story.
Why the spread matters for capital structures
Lenders price risk based on the trajectory of values, not just the level. A site at £900 per square foot in Westminster on a falling-value trajectory underwrites differently from a site at £700 per square foot in Walthamstow on a rising-value trajectory, even though both clear the financeability threshold.
Senior debt in the inner-prime correction zone is being priced cautiously. LTGDV ratios are coming in 5 percentage points lower than the equivalent connected-outer scheme. Margins are 50 to 100 basis points wider. Mezzanine appetite is materially thinner because the take-out value at completion carries more downside risk. Forward funding from institutional buyers is restricted to a handful of established assets.
Senior debt in the connected outer growth zone, by contrast, is competitive and proactively priced. Development finance is available from 6.5% per annum at 65 to 70% LTGDV. Mezzanine finance layers in at 12% per annum to take leverage to 90% of cost. BTR and PBSA forward-funding conversations are active across multiple operators.
The pricing table above sets out the differential at each layer of the stack.
What gets built, what gets paused, what gets repositioned
The 2026 delivery pipeline reflects the spread directly. Three patterns are visible in active deal flow.
In the inner-prime correction zone, schemes that secured planning before the recent value decline are being repositioned. Some are switching from open-market sale to BTR or rented residential, where institutional pricing values the asset on yield rather than headline GDV. Others are pausing to await either a value recovery or a more favourable rate environment. A small number are being restructured with meaningful discount-on-acquisition negotiations between consenting party and developer.
In the connected outer growth zone, schemes are starting on schedule. The capital stack is available, the values clear the £650 per square foot viability threshold, and lender appetite is strong. The bottleneck is planning consent — sites with consent are moving faster than at any point since 2022.
In the middle band — most of London’s boroughs — schemes are being assessed individually. Each scheme sits or falls based on micro-location, transport access, and product mix. There is no single answer for “the middle”.
What this means for site acquisition
The spread is a structural feature, not a momentary one. Site acquisition decisions in 2026 need to lead with which side of the spread the site sits on, not with the headline London number.
For sites in the inner-prime correction zone, the pricing of the senior layer alone may be enough to make a £900 per square foot site harder to fund than a £650 per square foot site in Walthamstow. The headline value is misleading on its own.
For sites in the connected outer growth zone, the question is not whether finance is available — it is. The question is whether the site clears the viability threshold on a credible build cost basis, whether the planning runway is short enough to capture the current rate environment, and whether the product mix gives optionality between open-market sale and forward-funded BTR or PBSA.
For full borough-by-borough sold price data, the regeneration pipeline references, and the underlying capital stack benchmarks behind this analysis, see the Greater London Property Market Report 2026.
See also: The £650/sq ft Cliff on YouTube, the foundational viability question that sits underneath the bifurcation, and Walthamstow +5.9% on YouTube, the lead outperforming borough on the connected-outer side of the split.
Listen to the full episode
For the dedicated deep dive on the inner-outer bifurcation, we have just published a stand-alone episode of the Construction Capital podcast: The London Bifurcation: 17 Points Apart Inside One City in 2026. Eleven minutes covering how the spread emerged, what is moving on each side, why lenders price the two ends as different markets, and what it means for site acquisition decisions in 2026.
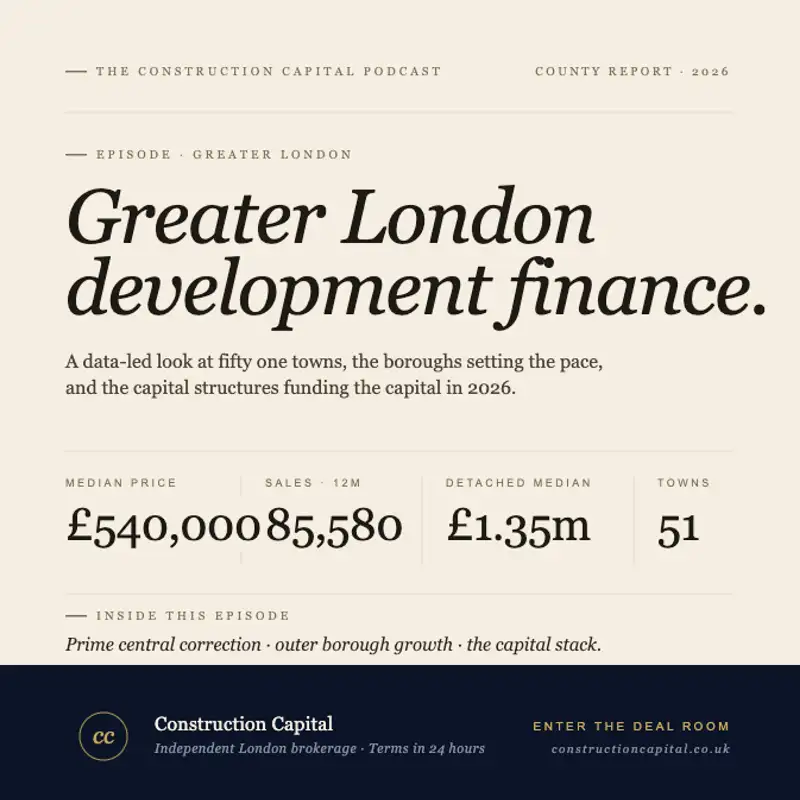
This piece also draws on Episode 2 of the Construction Capital podcast: Greater London Property Development Finance 2026: Market Analysis, House Prices and Lending Outlook. The wider Greater London 2026 context, including the £650 viability cliff and the Walthamstow +5.9% deep dive, sits across that series.
Listen anywhere
Listen on Apple Podcasts, Spotify, Overcast, Pocket Casts, or Amazon Music.
For indicative terms on a London scheme within 24 hours, submit through the Construction Capital deal room.
Published by Construction Capital, an independent capital advisory brokerage sourcing terms from over 100 lenders. This article is part of a 20-piece Greater London 2026 series accompanying the Construction Capital podcast.